Analyzers and Visualizers
Overview
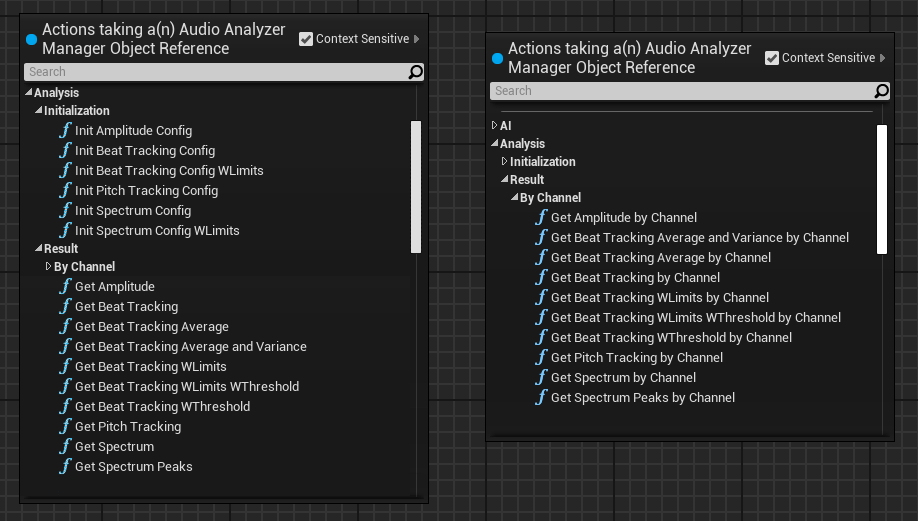
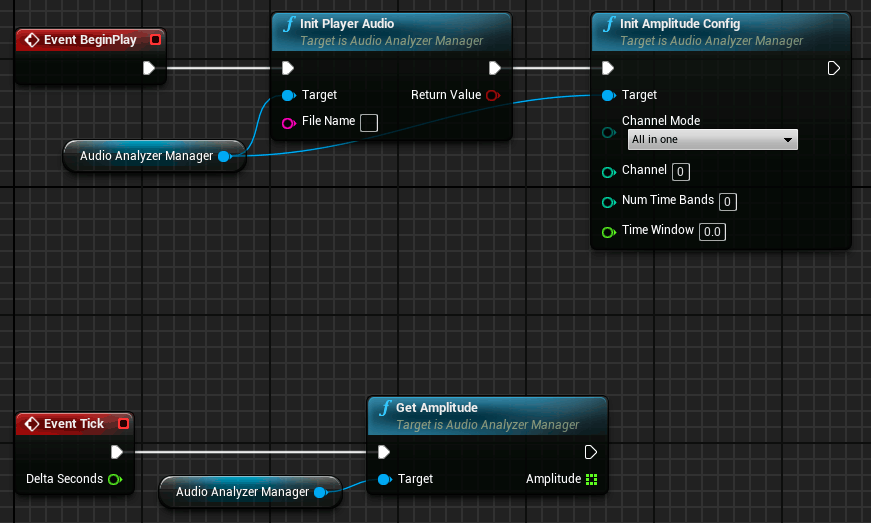
All visualizer goes with a pair of nodes Initxxx and Getxxx. Init nodes must be called before of the Get nodes to reserve the buffer analysis data, and after the audio source initialization. During the audio playback, you can use the player controls (Start/Stop/Pause) to interact with the analysis process.
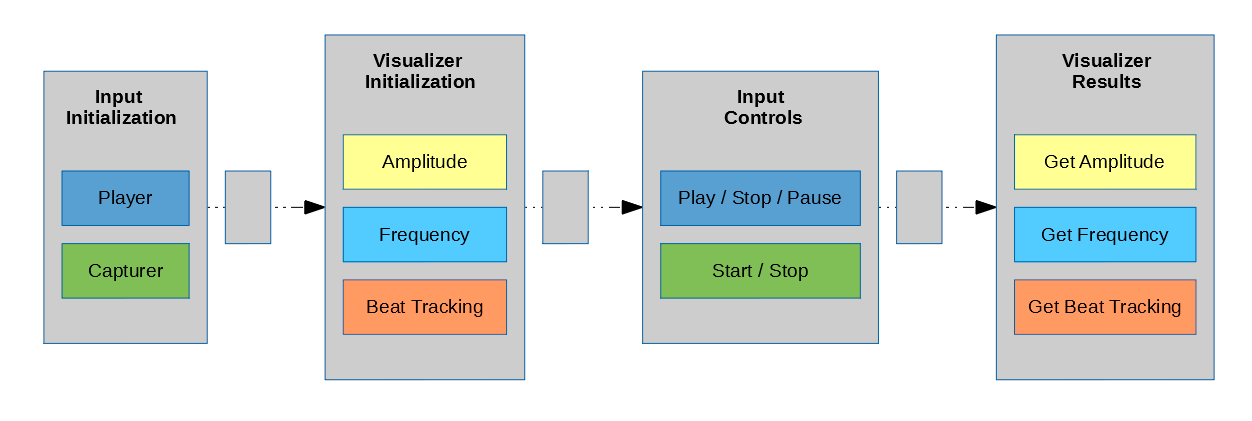
Visualizer nodes flow
Channel Result Object
All in one: Accumulates all channels data into only one array, to get the analysis result can be used the old Getxxx nodes
Select one: Returns only the channel specified in Channel option. Now to obtain only a Right Channel analysis you must select Channel Mode: Select one and Channel: 1
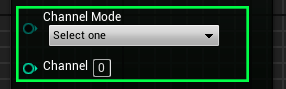
Split all: Returns each channel analysis into one array. You must use the new Getxxx By Channel nodes to retrieve the results. The output of this nodes are a Channel Result Object Reference. You can access to the number of channels and the data for each channel using the channel number as index.
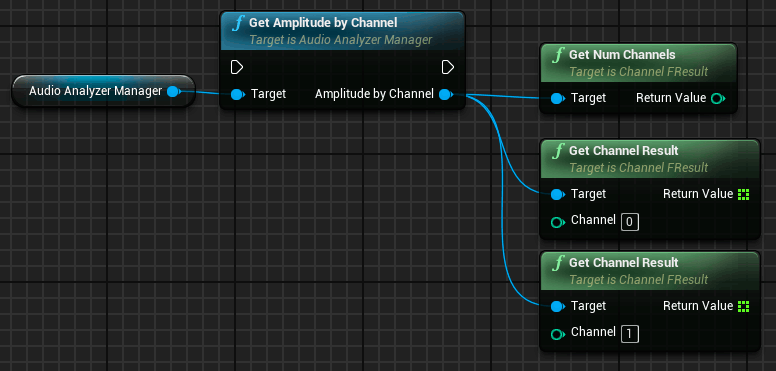
Channel |
Index of the channel |
Run Time Analysis nodes
Amplitude
One of the most basic audio visualizer, just to retrieve the amplitude values of the audio wave.
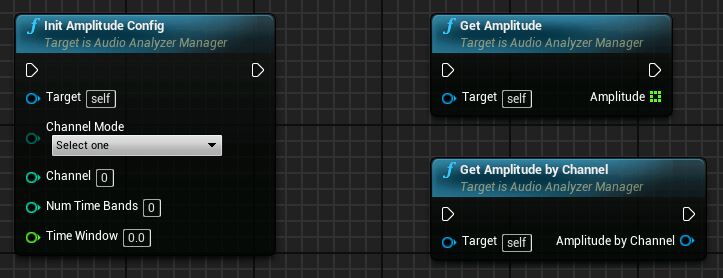
Channel Mode |
All in one, Select one, Split all |
Channel |
Number of channel to be analyzed (Only valid for Select one option) |
Num Time Bands |
Number of bands to display, it determines the resolution of the wave display |
Time Window |
Interval Time showed by the display in seconds |
Frequency spectrum
Visualize the frequency spectrum analysis. This analyzer include two frequency data distribution Linear and Logarithmic, but you can define too your own distribution feeding the init node with your own bounds for each band.
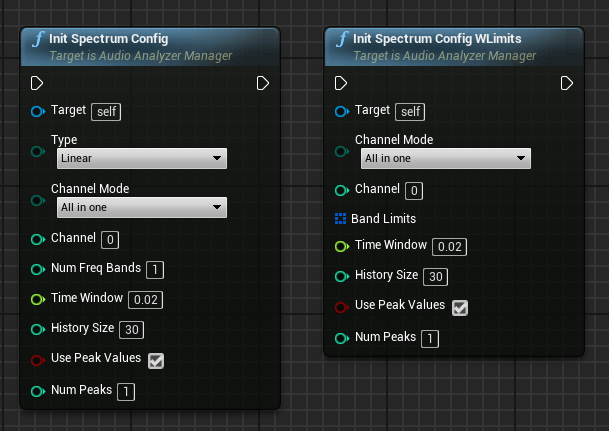
Type |
Linear, Logarithmic |
Channel Mode |
All in one, Select one, Split all |
Channel |
Number of channel to be analyzed (Only valid for Select one option) |
Num Freq Bands |
Number of bands to distribute the frequencies |
Time Window |
Time of the frequency sample |
History Size |
Number of samples used to calculate the average frequencies (Default: 1) |
UsePeakValues |
Returns peak value of the band instead of average value |
Num Peaks |
Num of frequency peaks to be calculated by Get Spectrum Peaks |
Channel Mode |
All in one, Select one, Split all |
Channel |
Number of channel to be analyzed (Only valid for Select one option) |
Band Limits |
TArray of Vector2D to define the bounds of each band, must be sorted and no overlap allowed (Closed Intervals) |
Time Window |
Time of the frequency sample |
History Size |
Number of samples used to calculate the average frequencies (Default: 1) |
UsePeakValues |
Returns peak value of the band instead of average value |
Num Peaks |
Num of frequency peaks to be calculated by Get Spectrum Peaks |
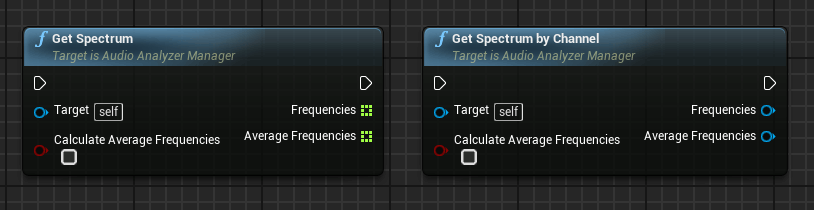
Calculate Averages Frequencies |
Calculates average frequency values too |
Calculate Averages Frequencies |
Calculates average frequency values too |
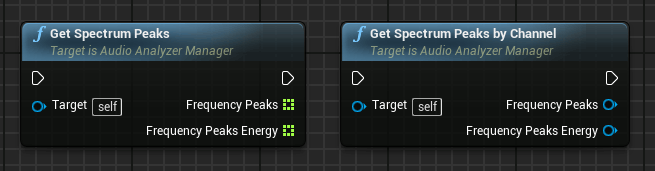
Frequency Peaks |
Value in Hz for the frequency peaks |
Frequency Peaks Energy |
Energy value for the frequency peaks |
Frequency Peaks |
Value in Hz for the frequency peaks |
Frequency Peaks Energy |
Energy value for the frequency peaks |
Beat Tracking
This beat tracking analyzer has a basic tracker configuration but you can configure your own tracking bounds too as in the spectrum analyzer. The pre-configured beat tracking use the next frequency limits to track the most valuable ranges of the spectrum.
Bass range: 0 - 87 Hz
Low Mid Range: 500 - 700 Hz
High Mid Range: 5000 - 12000 Hz
BPM Tracking

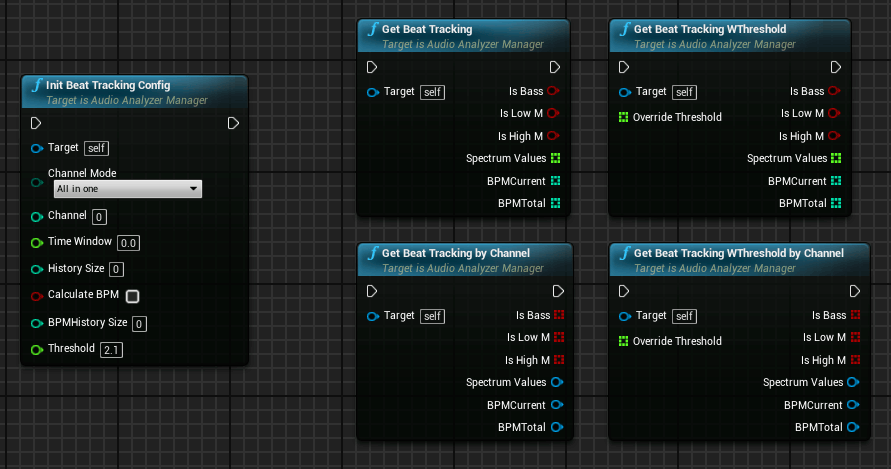
Channel Mode |
All in one, Select one, Split all |
Channel |
Number of channel to be analyzed (Only valid for Select one option) |
Time Window |
Time of the frequency sample |
History Size |
Number of samples used to calculate the average frequencies |
Calculate BPM |
Enable Beat-per-minute analysis |
BPM History Size |
Number of beat samples used to calculate the bpm. (Number of calls to GetBeatTracking node) |
Threshold |
Factor used to trigger the beat, values greater than Threshold * Average trigger this beat |
Override Threshold |
TArray to override the threshold factor for each band |
Override Threshold |
TArray to override the threshold factor for each band |
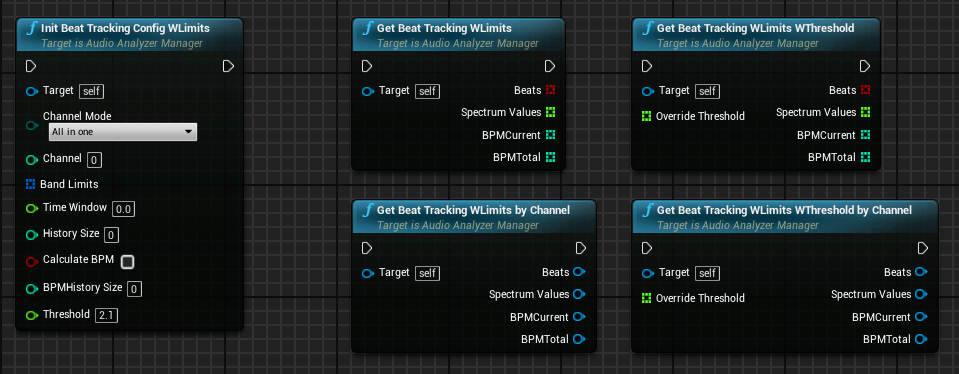
A basic beat tracking over a specific frequency bands, the band bounds can be defined, must be sorted and no overlap allowed (Closed Intervals)
Channel Mode |
All in one, Select one, Split all |
Channel |
Number of channel to be analyzed (Only valid for Select one option) |
Band Limits |
TArray of Vector2D to define the bounds of each band, must be sorted and no overlap allowed |
Time Window |
Time of the frequency sample |
History Size |
Number of samples used to calculate the average frequencies |
Calculate BPM |
Enable Beat-per-minute analysis |
BPM History Size |
Number of beat samples used to calculate the bpm. (Number of calls to GetBeatTracking node) |
Threshold |
Factor used to trigger the beat, values greater than Threshold * Average trigger this beat |
Override Threshold |
TArray to override the threshold factor for each band |
Override Threshold |
TArray to override the threshold factor for each band |
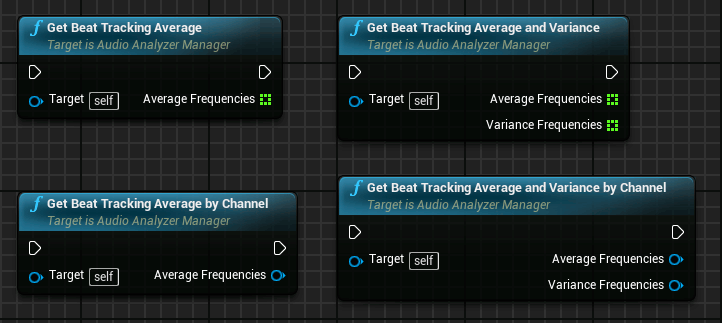
Some nodes to return intermediate values
Pitch Tracking
Now you can obtain the fundamental frequency of an audio in real-time. It’s an implementation using YIN algorithm.
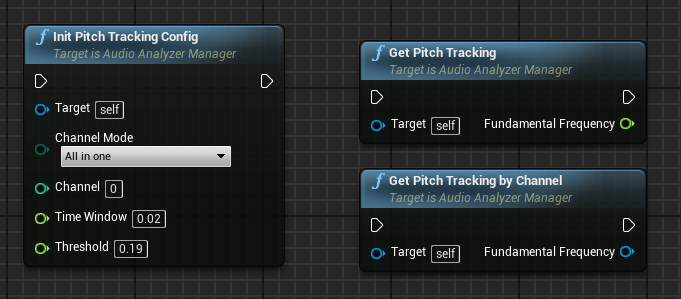
Channel Mode |
All in one, Select one, Split all |
Channel |
Number of channel to be analyzed (Only valid for Select one option) |
Time Window |
Time of the analysis sample |
Threshold |
Yin algorithm threshold (Default 0.19) |
Analysis Utils
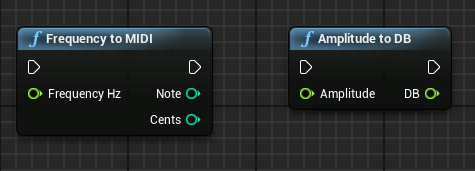
Frequency Hz |
Frequency value in hertz |
Amplitude |
Amplitude normalized value |
Offline Analysis nodes
Amplitude
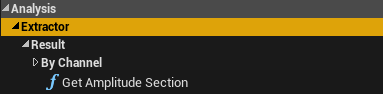
We need to initialize an Extractor instance to be able to use the offline analysis nodes
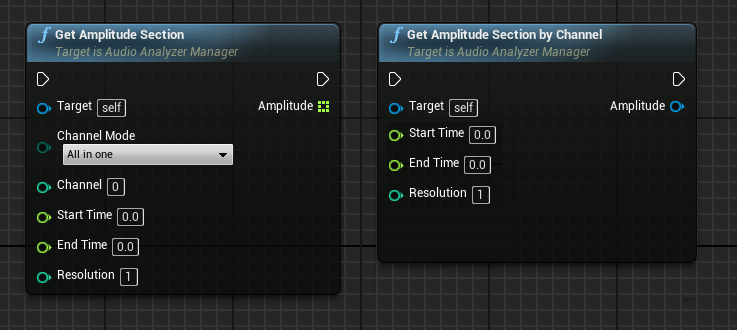
Channel Mode |
All in one, Select one, Split all |
Channel |
Number of channel to be analyzed (Only valid for Select one option) |
Start Time |
Start position of the section (in seconds) |
End Time |
End position of the section (in seconds) |
Resolution |
This is the number of samples grouped in each bar. With small values we can obtain more detail of the wave but more results too |