A short tutorial explaining how to extract the frequency spectrum of a sound for our rhythm/music games using UE4 and the library FMOD. In a previous tutorial we have seen how to configure UE4 for using FMOD library now we can make some experiments using this library. We are going to make a visualizer for the frequency spectrum and a beat detector too.
Part 1: Setting up project paths
Part 2: Using the library
Part 3: Frequency spectrum
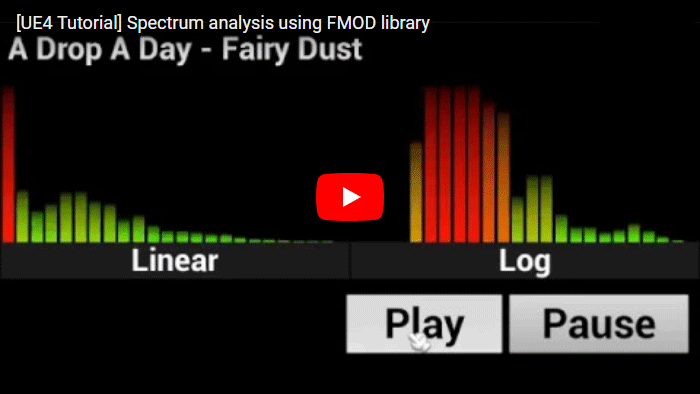
Part 4: UE4 spectrum visualizer
Part 5: Beat tracking algorithm
Part 6: UE4 beat visualizer
To be able to process a sound wave using digital devices the continuous signal of the wave has been converted to a sequence of samples (discrete time signal)
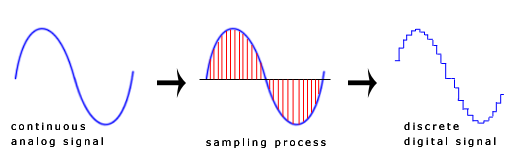
The higher the number of samples used, the more it will sound like the original wave. Nyquist theorem says that in order to reproduce an accurate signal, you need to sample at least twice faster than the highest frequency of the signal. Taking into account that the audible spectrum is in range 20 to 20,000 Hz, we will need a sample rate over 40,000 Hz. This is one of the reasons to see a sample value of 44100 or 48000 in our sound files.
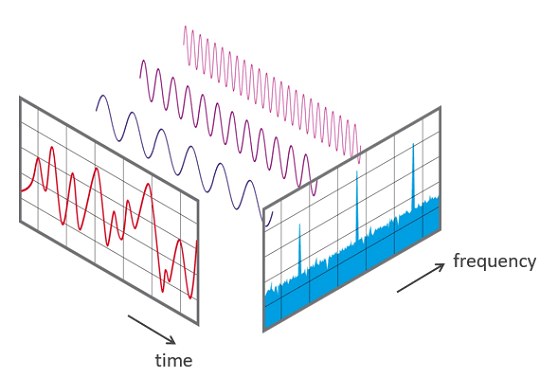
A frequency spectrum is a representation of the frequencies of the sound in a instant of time. Each bar of the spectrum represent a range of frequencies.
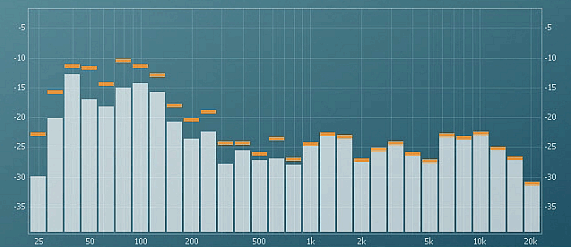
Any sound may be modeled as a combination of sinusoidal waveforms at different frequencies. The spectrum shows the amplitude of the wave for that frequency bar.
It isn’t different to what happens when we hear a sound. Our ears pick up the sum of all the sounds in the room at that particular time and position.
To convert a signal from its original time domain to a representation in the frequency domain we need to use a Fast Fourier transform
Now we can modifying our previous SoundManager_Fmod C++ class (Part 2: Using the library). We have two options to process our sound:
The first one is to process the sound completely before start playing it, and synchronize the data analysis during the playback. This is useful to use other libraries to do the FFT analysis, like KissFFT. To extract the sound data from the FMOD clases we need to copy their data (don’t forget to lock/unlock the access to the sound), and store it in a temporal container, we can use one for the left channel and other for the right.
_system->createSound(pathToFile.c_str(), FMOD_LOOP_NORMAL, 0, &_sound);

_sound->getLength(&_length, FMOD_TIMEUNIT_PCM);

//sound lock parameters
void* rawDataPtr;
unsigned int rawDataLength;
void* uselessPtr;
unsigned int uselessLength;

_LRawData.reserve(_length);
_RRawData.reserve(_length);

_sound->lock(0, _length, &rawDataPtr, &uselessPtr, &rawDataLength, &uselessLength);
for (unsigned int t = 0 ; t < _length ; ++t)
{
	_LRawData.push_back(((int*)rawDataPtr)[t]>>16);
	_RRawData.push_back((((int*)rawDataPtr)[t]<<16)>>16);
}
_sound->unlock(rawDataPtr, uselessPtr, rawDataLength, uselessLength);
The problem of this option is the time spent (copy & full analysis) when the sound file is relatively large. To avoid this is better to do a “real time” analysis, which is the one we are going to use. The first modification is to pass the flag FMOD_CREATESAMPLE to the createSound function. FMOD_CREATESAMPLE forces the decompression at loadtime, decompressing or decoding whole file into memory. Fastest for playback and most flexible.
_system->createSound(memoryPtr, FMOD_OPENMEMORY | FMOD_LOOP_NORMAL | FMOD_CREATESAMPLE, &sndinfo, &_sound);
To use the FFT analysis of FMOD we need to add a digital signal processor (DSP) over the channel of the sound. During the system initialization we can create and set the parameters of our DSP.
FMOD::DSP* _dsp;
_system->init(1, FMOD_INIT_NORMAL, NULL);

_system->createDSPByType(FMOD_DSP_TYPE_FFT, &_dsp);
_dsp->setParameterInt(FMOD_DSP_FFT_WINDOWTYPE, FMOD_DSP_FFT_WINDOW_TRIANGLE);
_dsp->setParameterInt(FMOD_DSP_FFT_WINDOWSIZE, _windowSize);
When our _channel variable is initialized, we can add the previous DSP to the channel and activate it later.
_system->playSound(_sound, 0, false, &_channel);

_channel->addDSP(0, _dsp);
_dsp->setActive(true);
To obtain the data of the FFT we need to use the getParameterData function of the DSP instance with the flag FMOD_DSP_FFT_SPECTRUMDATA. Besides this, we need to call to system->update() once per game tick, or once per frame, to update the FMOD system. We can use the Tick event of UE4 to make both function calls.
Linear spectrum
To make a linear analysis of the spectrum we need to split the data into bands, as our example has a windowSize of 1024 we are group together 1024 / num-of-Bands frequencies in each band.
dspFFT->spectrum returns the data structure of the FFT by channel and frequency, for this example we need to process 2 channels, left and right, we take the average value of both channels.
int SoundManager_Fmod::initializeSpectrum_Linear(int maxBands)
{
	int barSamples = (_windowSize / 2) / maxBands;

	//calculates num fft samples per bar
	_numSamplesPerBar_linear.clear();
	for (int i = 0; i < maxBands; ++i)
	{
		_numSamplesPerBar_linear.push_back(barSamples);
	}
	return _numSamplesPerBar_linear.size(); //effectiveBars
}

void SoundManager_Fmod::getSpectrum_Linear(float* spectrum)
{
	FMOD_DSP_PARAMETER_FFT* dspFFT = NULL;
	FMOD_RESULT result = _dsp->getParameterData(FMOD_DSP_FFT_SPECTRUMDATA, (void **)&dspFFT, 0, 0, 0);
	if (dspFFT)
	{
		// Only read / display half of the buffer typically for analysis
		// as the 2nd half is usually the same data reversed due to the nature of the way FFT works.
		int length = dspFFT->length / 2;
		int numChannels = dspFFT->numchannels;

		if (length > 0)
		{
			int indexFFT = 0;
			for (int index = 0; index < _numSamplesPerBar_linear.size(); ++index)
			{
				for (int frec = 0; frec < _numSamplesPerBar_linear[index]; ++frec)
				{
					for (int channel = 0; channel < numChannels; ++channel)
					{
						spectrum[index] += dspFFT->spectrum[channel][indexFFT];
					}
					++indexFFT;
				}
				spectrum[index] /= (float)(_numSamplesPerBar_linear[index] * numChannels);
			}
		}
	}
}
initializeSpectrum_Linear calculates how many samples we are gonna take for the spectrum bar, for a linear distribution its trivial, we are gonna take the same number of samples for each bar. We would make this logic into the getSpectrum_Linear function, but we want to keep a similar code distribution with the next spectrum split algorithm.
This is a basic linear spectrum
The problem of this spectrum is that we group together a lot of useful information in the first bars losing important details in the lower frequencies. Most of the useful information in the spectrum is all below 15000 Hz.
Logarithmic spectrum
A better way to group the spectrum would be in a logarithmic split of the FFT results.

A natural way to do this is for each average to span an octave. We could group frequencies like so (this assumes a sampling rate of 44100 Hz):
0 to 11 Hz
11 to 22 Hz
22 to 43 Hz
43 to 86 Hz
86 to 172 Hz
172 to 344 Hz
344 to 689 Hz
689 to 1378 Hz
1378 to 2756 Hz
2756 to 5512 Hz
5512 to 11025 Hz
11025 to 22050 Hz
This gives us only 12 bands, but already it is more useful than the 32 linear bands. If we want more than 12 bands, we could split each octave in two, or three, the fineness would be limited only by the size of the FFT.
We can precalculate this values using the next code:
frequencyOctaves.push_back(0);
for (int i = 1; i < 13; ++i)
{
		frequencyOctaves.push_back((int)((44100 / 2) / (float)pow(2, 12 - i)));
}
And make a grouping of the FFT data using this limits. Take into account than frequency values below the first component of our FFT can’t be represented in the visualizer, so the range 0-11Hz, 11-22Hz and 22-43Hz must be grouped together in the first bar for this example. The first component of the FFT data, corresponding for the range 0-43Hz, will be set to the first bar, discarding the bars of the 0-11 and 11-22. Depending on the octave divisions this solution must be applied to the next intervals too.
When we know how many samples we need for each bar, we only need to iterate through the FFT data taking the average of this samples.
int SoundManager_Fmod::initializeSpectrum_Log(int maxBars)
{
	//calculates octave frequency
	std::vector<int> frequencyOctaves;
	frequencyOctaves.push_back(0);
	for (int i = 1; i < 13; ++i)
	{
		frequencyOctaves.push_back((int)((44100 / 2) / (float)pow(2, 12 - i)));
	}

	int bandWidth = (44100 / _windowSize);
	int bandsPerOctave = maxBars / 12; //octaves

	//calculates num fft samples per bar
	_numSamplesPerBar_log.clear();
	for (int octave = 0; octave < 12; ++octave)
	{
		int indexLow = frequencyOctaves[octave] / bandWidth;
		int indexHigh = (frequencyOctaves[octave + 1]) / bandWidth;
		int octavaIndexes = (indexHigh - indexLow);

		if (octavaIndexes > 0)
		{
			if (octavaIndexes <= bandsPerOctave)
			{
				for (int count = 0; count < octavaIndexes; ++count)
				{
					_numSamplesPerBar_log.push_back(1);
				}
			}
			else
			{
				for (int count = 0; count < bandsPerOctave; ++count)
				{
					_numSamplesPerBar_log.push_back(octavaIndexes / bandsPerOctave);
				}
			}
		}
	}

	return _numSamplesPerBar_log.size(); //effectiveBars
}

void SoundManager_Fmod::getSpectrum_Log(float* spectrum)
{
	FMOD_DSP_PARAMETER_FFT* dspFFT = NULL;
	FMOD_RESULT result = _dsp->getParameterData(FMOD_DSP_FFT_SPECTRUMDATA, (void **)&dspFFT, 0, 0, 0);
	if (dspFFT)
	{
		// Only read / display half of the buffer typically for analysis
		// as the 2nd half is usually the same data reversed due to the nature of the way FFT works.
		int length = dspFFT->length / 2;
		int numChannels = dspFFT->numchannels;

		if (length > 0)
		{
			int indexFFT = 0;
			for (int index = 0; index < _numSamplesPerBar_log.size(); ++index)
			{
				for (int frec = 0; frec < _numSamplesPerBar_log[index]; ++frec)
				{
					for (int channel = 0; channel < numChannels; ++channel)
					{
						spectrum[index] += dspFFT->spectrum[channel][indexFFT];
					}
					++indexFFT;
				}
				spectrum[index] /= (float)(_numSamplesPerBar_log[index] * numChannels);
			}
		}
	}
}
We can see that getSpectrum_Log has the same logic than the getSpectrum_Linear but using the Logarithmic split of the FFT data instead of the linear.
In the next tutorial we are going to make a simple visualizer for this spectrum values using Unreal Engine 4, valid for Win64 and Android platform.
Part 4: UE4 spectrum visualizer
Tutorial files
2020/06/22 – Updated to Unreal Engine 4.24
You may also like:


Support this blog!
For the past year we have been dedicating more of our time to the creation of tutorials, mainly about game development. If you think these posts have either helped or inspired you, please consider supporting this blog. Thank you so much for your contribution!


Thank you for your sharing. Recently I’ve been reading this series.
I just noticed that you said above that frequency ranges of 0-11Hz and 11-22Hz must be grouped together with 22-43Hz. I couldn’t figure this out. Could you explain it to me why they have to be combined?
Thank you.
Sure. We are using an audio file with a sample rate of 44100 and a FFT window of 1024, so we can say each position of the FFT result represent a group of 44100 / 1024 = 43Hz.
With a bigger FFT window the result then have smaller groups, for example with a window of 2048 each position of the result represent 21Hz.
The FFT result is in linear progression so the first position represent until 43Hz, the second 86Hz, next 172Hz… Now we need to make as many group as bands we want to show in your final spectrum. The size of this groups depends of what Hz we want to represent on each band. For example if we wann to make only 3 bands, bass-mid-high, we can group all the FFT result buckets that represent frequencies below 300Hz in the first position, then group from 300Hz until 2000Hz in the middle band, and group the rest on our last band.
You can group as you want
Thank you for your clear and patient explanation.
Best wishes.